Data-Driven Documents (D3) applied to Conceptual Ship Design Knowledge
v0.1, Apr. 2014
Based on the paper published at COMPIT, 2014, Newcastle, UK
by Henrique M. Gaspar12, Per Olaf Brett2, Ali Ebrahim2, Andre Keane2.
1 – Aalesund University College, Faculty of Maritime Technology and Operations
2 – Ulstein International AS.

Abstract
This work focuses on data-driven documents (D3) examples applied to the conceptual ship design process, especially in how to effectively and quickly filter and present complex input, multilevel and multiclient interactions, associating into design knowledge. The traditional ship breakdown structure, with cost and subsystems elements, is encapsulated via analogous representations, such as tree layout, force layout, pack layout, sunburst layout, and Sankey diagrams. Large dependency matrixes are represented via interactive chord diagrams (dependency wheel and hierarchical edge bundling). A parametric design web application is used as example, to tie in a single structure knowledge representation. An overall discussion is presented, focusing on how this approach improves the expressiveness of data and interactions in an industrial ship design context, allowing the designer to better interact with a conceptual ship design dataset, as well as facilitating the presentation of the expectations of stakeholders involved.
 a
a b
b


3.2 Basic Features
The fundamentals of D3 are introduced by Bostock et al. (2011) and Bostock (2014). In summary, it works as an interpreter to select, modify, and transform plain data into web visual elements (scalable vector graphs). Moreover, a collection of application programming interfaces (APIs) is available to facilitate the process of creating regular graphs, such as bar, scatter, line, and area charts, Kiernander et al. (2014). Fig.4 presents a simple XY regression (a) and a multiple bar chart (b) created with D3.
a) Simple XY scatter with regression
b) Simple Bar Chart (D3 + dimple)
Fig.4 – An XY regression (a); and a multiple bar chart (b) developed using D3.
D3 advantages relate to a high level of customization and user interactivity. Mouse actions, for instance, can be customized for each element of the graph. Fig.4a shows a scatter plot with regression equation, which presents the coordinates when the mouse is over a point, pretty much as in modern spreadsheets’ charts. Fig.4b shows a multiple bar chart, where the mouse over action generates a pop-out box containing design information about the data connected to each bar.
Fig.5 presents a more advanced design-space plot, containing Utility A versus Utility B of four design sets plotted together. One more dimension is added, since the cost is proportional to the size of the circle. In Fig.5a we are able to analyse all design sets, and a click on the mouse filters the data into a single set.
Scatter / Bubble Chart
Fig.5: Utility plot of four design sets (and filtering of a single set, developed using D3 and Dimple API
It is essential to refine and make better the understanding of the design set during the early stages by documenting the design and preparing a comprehensive scope of work containing product specifi-cation, required standards, regulations, mission requirement, and client expectations. Although D3 can be used to produce spreadsheet-like charts, the real gain in knowledge is observed when we go beyond these functionalities, using this library to handle data that heretofore was considered static. More powerful visual techniques in early stages will enhance the possibility of producing a better grasp of design space, product mission, and performance objectives in a collaborative space, rather than just traditional visualization methods.
In Section 4 we introduce visualisation examples that lie beyond this spreadsheet-like approach, focusing on structural, mapping, temporal, and economic aspects of concept ship design.
4. Extracting Ship Design Knowledge - Examples of Visualizations
4.1 Structural Examples
The structural aspect relates to arrangement and interrelationships of the physical parts in the ship. The structure/behavior pair derives from form-function mapping, aggregating information covered extensively in traditional model-based techniques. The structure is decomposed and encapsulated in subsystems and components, Gaspar et al. (2012). Current design methods, such as Levander (2006), decompose the design into ship and task related subsystems, presenting a functional breakdown of the system into semi-independent parts. A more modular approach, for example, is presented by Andrews and Pawling (2009), with building block as a design method, connecting this decomposition into the simulation of modular chunks performance.
For the sake of illustration, let’s consider Erikstad and Levander’s (2012) decomposition for offshore support vessels (OSVs) presented in Fig.6. This type of information is usually visualized statically, with limited interaction and investigation of all the sub-levels that this breakdown can have. Translating this data into an object oriented-data, with each subsystem connected to a parent – as well as any other type of value or property – we obtain the type of object found in Table I. Table I data can be bound to a variety of D3 visualizations, exemplified in Fig.7 (tree layout), Fig.8 (sunburst layout), Fig.9 (pack layout), and Fig.10 (force layout). These visualisations are highly interactive, allowing the user to understanding and explore the many underlined properties of each subsystem, such as value in the form of a “bubble size,” and its connection with other elements. Data can also be connected to an external library, such as 3D software and classes with ship’s modules, blocks, and parts.
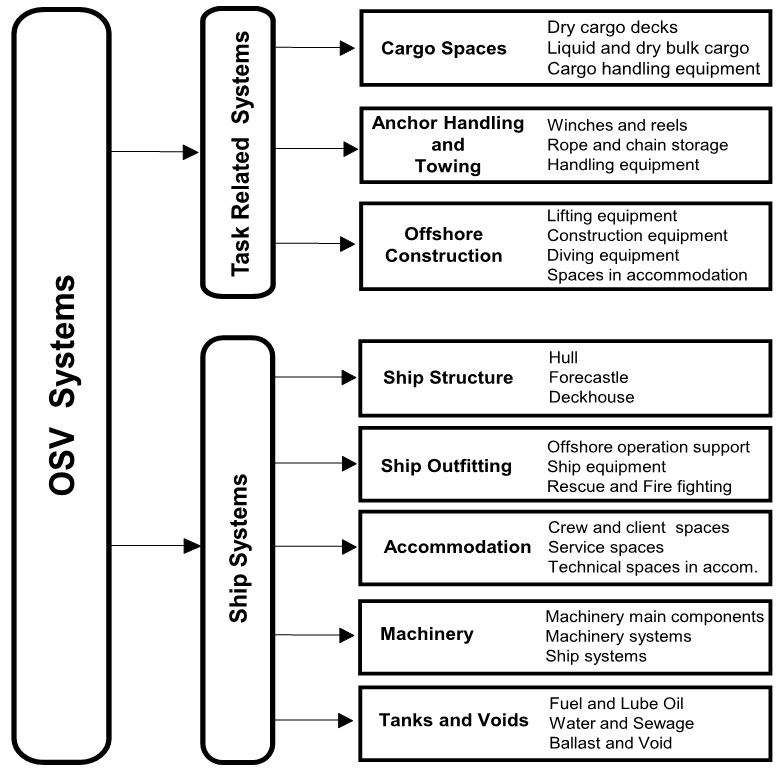
Fig.6: Static representation of OSV systems decomposition, Erikstad and Levander (2012).
 var Data_OSV_Systems = [
{ "name" : "OSV Systems", "parent":"null},
{ "name" : "Cargo Spaces", "parent":"Task Related Systems"},
{ "name" : "Dry cargo decks", "parent":"Cargo Spaces"},
{ "name" : "Liquid and dry cargo bulk", "parent":"Cargo Spaces"},
{ "name" : "Cargo handling equipment", "parent":"Cargo Spaces"},
{ "name" : "Anchor Handling and Towing", "parent":"Task Related Systems"},
{ "name" : "Winches and reels", "parent":"Anchor Handling and Towing},
{ "name" : "Rope and chain storage", "parent":"Anchor Handling and Towing"},
{ "name" : "Handling equipment", "parent":"Anchor Handling and Towing"},
{ "name" : "Offshore Construction", "parent":"Task Related Systems"},
{ "name" : "Lifting equipment", "parent":"Offshore Construction"},
{ "name" : "Construction equipment", "parent":"Offshore Construction"},
{ "name" : "Diving equipment", "parent":"Offshore Construction"},
{ "name" : "Spaces in accommodation", "parent":"Offshore Construction"},
{ "name" : "Ship Structure", "parent":"Ship Systems"},
{ "name" : "Hull", "parent":"Ship Structure"},
{ "name" : "Forecastle", "parent":"Ship Structure"},
{ "name" : "Deckhouse", "parent":"Ship Structure"},
{ "name" : "Ship Outfitting", "parent":"Ship Systems"},
{ "name" : "Offshore operation support", "parent":"Ship Outfitting"},
{ "name" : "Ship equipment", "parent":"Ship Outfitting"},
{ "name" : "Rescue and fire fighting", "parent":"Ship Outfitting"},
{ "name" : "Accommodation", "parent":"Ship Systems"},
{ "name" : "Crew and client spaces", "parent":"Accommodation"},
{ "name" : "Service spaces", "parent":"Accommodation"},
{ "name" : "Technical spaces in accom.", "parent":"Accommodation"},
{ "name" : "Machinery", "parent":"Ship Systems"},
{ "name" : "Machinery main components", "parent":"Machinery"},
{ "name" : "Machinery systems", "parent":"Machinery"},
{ "name" : "Ship systems", "parent":"Machinery"},
{ "name" : "Tanks and Voids", "parent":"Ship Systems"},
{ "name" : "Fuel and lube oil", "parent":"Tanks and Voids"},
{ "name" : "Water and sewage", "parent":"Tanks and Voids"},
{ "name" : "Ballast and void", "parent":"Tanks and Voids"},
{ "name" : "Ship Systems", "parent":"OSV Systems"},
{ "name" : "Task Related Systems", "parent":"OSV Systems"}
];
Classic tree diagram
Fig.7: D3 Tree layout from Table I data
Sunburst layout
Fig.8: D3 sunburst layout from Table I data
Pack layout
Fig. 9: D3 pack layout from Table 1 data
Force layout
Fig.10: D3 force layout from Table 1 data
4.2 Temporal Examples
Representation of temporal knowledge is determined by the way in which time is specified and measured. Similarly, in conceptual ship design, the temporal aspect pertains to the dimensions and properties of a system over time, including potential contextual shifts and uncertainties. To take these traits into consideration during early stages has been extensively peripheral to systems engineering practice, but is particularly important because of the need for anticipatory analysis, which enables the identification of concept designs that perform well across multiple contexts, and inherently create higher value and utility margins for stakeholders.
In order to fully understand the benefits of mitigating uncertainty inherent in temporal analysis, the input scope must also be presented. As an input variable and a significant contributor of complexity, the contextual aspect consists of external entities, interfaces, and other factors defining the systems behavior. This should be taken into account during early phase design because the vast amount of changing characteristics could serve as substantial hinders of future profitability if not dealt with accordingly. By defining scenarios subject to these types of constraints, a set of alternate futures can be modelled and visualized, ultimately giving the designer a better foundation on which to base governing decisions.
To properly handle these contextual and temporal aspects, a similar structure explained in Section 4.1 can be applied to temporal data. This structure calls for first organizing the design set in terms of its properties, Fig.11a, and later analyzing and envisaging each of the designs analyzed for each of the scenarios, Fig.11b. Besides tree layout, sunburst, pack, and force layouts can be similarly applied to represent similar temporal data.
a) Design Set
b) Scenario Set
Fig.11: D3 tree layout for visualizing a design set (a) and a scenario set, with all designs analyzed for every scenario (b)
4.3 Design Factors Relationship Mapping Examples
Design factors relationship mapping is a structured process for creating the correct understanding of (and feel for) the final product in preliminary design stages. Design mapping methods are particularly useful for: Making informed design decisions, identifying areas of opportunity for developing new products, analyzing a competitive landscape, and analyzing complex, changing, and ambiguous design problems.
Relationship mapping techniques have a significant role in demonstrating vessel required mission and objectives, as well as consequences of different design scenarios on final product performance, with its correlation among different design parameters, decision making techniques, and market based design solutions. A useful mapping visualization will make a better understanding of the product and an earlier agreement among stakeholders, leading to a more reliable design and, consequentially, lower changes in further product lifecycle phases.
Fig.12a presents a typical three-leveled design mapping, connecting value with performance attrib-utes, and performance with design characteristics (adapted from Erikstad (2014)). Such a relationship can also be transformed into an object-like data, allowing the interactive visualization from Fig.12b.

Fig.12a: Design Factors Relationship Mapping Example (Erikstad, 2014).
Value - Performance - Design Mapping
Fig. 12b The static connection from 12a can be transformed into the bundle diagram of 12b.
Another advantage of this approach is the plot of dependencies between two or more factors. For the sake of exemplification, let’s say that we are able to connect three missions of an OSV (anchor handling, supply, and towing) into each vessel capability. This data is exemplified in Table II. Fig.13 introduces how a chord diagram can effectively contribute to the clarification of such complex data, with a dependency wheel able to efficiently present, Fig.13a, and filter, Fig.13b, the mission-capabilities relationships.
|
Chord diagram
Fig.13: Chord diagram to represent and filter dependencies between mission and vessel capabilities
4.4 Economic Examples
Economic aspects are strongly connected to the physical parts of the system. Considering the data exemplified in Table I, we can assume that each subsystem of the vessel will have a certain material cost, which can be added as a property of that object, for instance “cost: value”.
Therefore, we are also able to create the same range of examples provided in Section 4.1. Fig.14 presents an interactive version of the sunburst, which represents in one chart the total material cost of a vessel, Fig.14, while neatly identifying the cost of each subsystem with a mouse-over action.
Sequence Sunburst
of cost is related to this systems
Fig.14: Sunburst to represent material cost of a design (a) and a mouse-over filter to show the cost of a specific subsystem
If we consider another economic property linked to each subsystem, such as the man-hours used in that subsystem during the vessel construction, we may create a relationship between the material and man-hours cost. This diagram is statically represented by Levander (2006) in Fig.15a, which can be dynamically transformed (and updated) via a Sankey diagram using D3, observed in Fig.15b.

Fig.15a: Economic relationship between material and man-hours cost, statically illustrated by Levander (2006)
Fig.15b: Economic relationship between material and man-hours cost, dynamically illustrated via D3 Sankey diagrams
5. Simple Parametric Model in HTML and JavaScript
The objective of the parametric design procedure is to establish a consistent parametric description of the vessel in the early stages of design, starting from the basic design principle that a certain description of a vessel should be able to perform efficiently a given mission. The scope of the project is to present an entire but simplified iteration of the parametric design process applied to OSVs, starting from the mission parameters until the final design characteristics and attributes. This project is supported by Ulstein Group (... click to access the example)
6. Discussion and Concluding Remarks
In this paper we have demonstrated some of the early phase design visualizations and interactions by use of the D3.js library. The focus has largely been structural components, economic aspects, and especially hierarchical breakdowns. Even so, we have barely breached the limitations of today’s current static practice. Data-drive documentation is by no means limited to the representation of a vessel’s physical traits, but can also be used to visualize meteorological conditions such as ice density, wave height, temperature, and other vital pieces of information such as the boundaries of certain regulations when conceptualizing high level requirements into lower level capabilities.
The approach’s advantages can be summarized as the ability to efficiently store and present non-trivial data, such as hierarchical information, in an easy to share setting. Its high level of customization, although requiring JavaScript coding, allows intensive multi-platform interactivity, as well as association with proprietary simulations tools and design databases.
Moreover, the visualization of exorbitant amounts of information, whether obtained via experience or simulation database, is not just relevant in order to increase our limited ability to gain value through cognitively processing raw data, but also to uncover the value decreasing aspects. The identification of a parametric outlier could potentially increase the final product’s performance just as much as any recognised positive contributor, and may even be even harder to identify amongst the plethora of non-prominent attributes.
It is our belief that using data-driven documentation on a web based dynamic environment, during early ship design stages, will enhance the possibility of improving the design understanding, operational profiles, and performance objectives. This extension of the spreadsheet-like approach aligns with a more holistic design approach, such as in ABD, allowing an interactive empiric and simulation data exploration multi-stakeholder environment.
There is however a known challenge associated with state of the art technological developments regarding the end user’s process of adaptation – a critical step towards qualification and acceptance. In general, demanding processes such as ship design will stick to proven solutions because the risk associated with trials of new solutions is simply too high. Getting key users to adopt these alternative methods is of the utmost importance in order to gain vital feedback so that the proposed solutions continually can be improved upon, and subsequently enable designers to save both time and money by eliminating faults and illuminating possibilities much earlier than previous practices.
References and Disclaimer
The models presented here are based on the examples made available online by Bostock (2014), Kiernander et al. (2014) and Zaninnoto (2014), and their uses and rights are stated by each specific library/API license.
References
AAMODT, A. (1991), A knowledge-intensive, integrated approach to problem solving and sustained learning, PhD Thesis, NTNU
ANDREWS, D.J. (2003), Marine design: requirement elucidation rather than requirement engineer-ing, 8th Int. Maritime Design Conf., Athens
ANDREWS, D.J. (2011), Marine requirements elucidation and the nature of preliminary ship design. Trans. RINA 153 pp.23-39
ANDREWS, D.J.; PAWLING, R., (2009), The impact of simulation on preliminary ship design, 10th Int. Marine Design Conf., Trondheim
ANSCOMBE, F.J. (1973). Graphs in statistical analysis, American Statistician 27/1, pp.17–21
BOSTOCK, M.; OGIEVETSKY, V.; HEER, J. (2011), D3: Data-Driven Documents, IEEE Trans. Visualization and Computer Graphics
BOSTOCK, M. (2014); D3: Data-Driven Documents, http://d3js.org/
BRETT, P.O. (2012), Industry insights – Accelerated business development - The Challenge, BI - Norwegian School of Management
ERIKSTAD S. O. (2014), Design mapping: Value attributes, performance attributes and design characteristics, UNPUBLISHED.
BRETT, P.O.; BOULOUGOURIS, E.; HORGEN, R.; KONOVESSIS, D.; OESTVIK, I.; MERMI-RIS, G.; PAPANIKOLAOU, A.; VASSALOS, D.A. (2006), Methodology for the logistics-based ship design, 9th Int. Marine Design Conf., Ann Arbor
ERIKSTAD, S.O. (1996), A decision support model for preliminary ship design, PhD Thesis, NTNU
ERIKSTAD, S.O. (2007), Efficient exploitation of existing corporate knowledge in conceptual ship design, Ship Technology Research 54
ERIKSTAD, S.O.; LEVANDER, K. (2012), System based design of offshore support vessels, 11th Int. Maritime Design Conf., Glasgow
FEW, S. (2009), Now you see it: Simple visualization techniques for quantitative analysis, Analytics Press
GASPAR, H.M.; ROSS, A.M.; ERIKSTAD, S.O. (2011), Handling temporal complexity in the design of non-transport ships using epoch-era analysis, Trans. RINA 154, Part A3, Int. J. Mar. Eng.
GASPAR, H.M.; ROSS, A.M.; RHODES, D.H.; ERIKSTAD, S.O. (2012), Addressing complexity aspects in conceptual ship design - A systems engineering approach, Trans. SNAME 120
HAMMING, R. (1962), Numerical methods for scientists and engineers, McGraw-Hill
KIERNANDER, J. et al. (2014), Dimple - An object-oriented API for business analytics powered by d3, http://dimplejs.org/
LEVANDER, K. (2006), System based ship design, NTNU
PARSONS, M.G. (2004), Parametric design, Ship Design and Construction Vol. 1, SNAME
PMBOK (2008), A Guide to the Project Management Body of Knowledge (PMBOK Guide), Project Management Institute
SINGER, D.J.; DOERRY, N.; BUCKLEY, M.E. (2009), What is set-based design? Naval Eng. J. 121/4, pp.31-43
TUFTE, E.R. (2001), The visual display of quantitative information, Graphics Press
TUFTE, E.R. (2006), Beautiful evidence, Graphics Press
ULSTEIN, T.; BRETT, P.O. (2012), Critical systems thinking in ship design approaches. 11th Int. Maritime Design Conf., Glasgow
WARE, C. (2012) Visual thinking for design, Morgan Kaufmann Series in Interactive Technologies
ZANINOTTO, F. (2014), DependencyWheel: An interactive visualization of package dependencies, http://redotheweb.com/DependencyWheel/